Introduction to Centralized Logging with Loki and Nginx
If you're reading something like this, you probably have at least one service connected to the internet. You probably occasionally grep and tail its logs by hand. Would it be cool if we could introduce an enterprise log aggregation system, just on a smaller scale? Yeah, let's do it.
There are already some getting started tutorials for Loki, but I figured it would be easier to demonstrate with a simple use case.
What we're going to do:
- Setup Loki in single binary mode, optionally with object storage.
- Update Nginx to output access logs in json format.
- Setup Promtail to ship logs to Loki.
- Plug Loki into Grafana.
Prerequisites:
- A Debian or RedHat style Linux server of some sort running Nginx.
- Grafana, which is already easy and well documented. See Debian and RedHat instructions.
- Basic sysadmin skills.
Setting up the Grafana repository
Okay, so either on your existing server, or on a new one, add the appropriate Grafana repository, which for this document is ideally Debian/Ubuntu or RedHat/Fedora. Follow the links for instructions.
Install Loki and Promtail accordingly.
Loki is the logging system, Promtail is the utility to ship logs to it.
# RHEL/Fedora
dnf install loki promtail

# Debian/Ubuntu
apt install loki promtail

# Either way, don't run unconfigured
systemctl stop loki promtail
mkdir -p /var/lib/loki/storage
chown -R loki /var/lib/loki
Configuring Loki
You have the option to keep all logs on disk. Ideally, though, you keep long term storage in an object store, such as AWS S3, Akamai Object Storage, or Digital Ocean Spaces. I personally use Akamai and it'll cost you a whopping $5/mo unless you're doing something crazy with it.
Now that Loki is installed, we need to setup /etc/loki/config.yml. Below is based on my configuration. Note the comments about object vs local storage, only include the block relevant to you.
auth_enabled: false

server:
  http_listen_port: 3100
  grpc_listen_port: 9096

common:
  instance_addr: 127.0.0.1
  path_prefix: /var/lib/loki
  replication_factor: 1
  ring:
    kvstore:
      store: memberlist

limits_config:
  split_queries_by_interval: 0

query_range:
  results_cache:
    cache:
      embedded_cache:
        enabled: true
        max_size_mb: 100

frontend:
  max_outstanding_per_tenant: 4096
  compress_responses: true


### USE THIS BLOCK IF USING LOCAL STORAGE
schema_config:
  configs:
    - from: 2020-07-01
      store: tsdb
      object_store: filesystem
      schema: v13
      index:
        prefix: index_
        period: 24h

storage_config:
  filesystem:
    directory: /var/lib/loki/storage
### END LOCAL STORAGE BLOCK

### USE THIS BLOCK IF USING OBJECT STORAGE
schema_config:
  configs:
    - from: 2020-07-01
      store: tsdb
      object_store: aws
      schema: v13
      index:
        prefix: index_
        period: 24h

storage_config:
  tsdb_shipper:
    active_index_directory: /var/lib/loki/tsdb-index
    cache_location: /var/lib/loki/tsdb-cache
  aws:
    s3: https://YOURACCESSKEYHERE:YOURSECRETKEHERE@BUCKETURL/BUCKETNAME
    #                                   EXAMPLE    us-east-1.linodeobjects.com/blakes-loki-demo
    insecure: false
    s3forcepathstyle: true

compactor:
  working_directory: /var/lib/loki/compactor
  compaction_interval: 15m
### END OBJECT STORAGE BLOCK

analytics:
  reporting_enabled: false
Reconfiguring Nginx logging
Alright, you have Nginx running somewhere, right? You might as well install it here so we can reverse proxy Loki at some point.
dnf install nginx

OR

apt install nginx
Now, find a spot in the http block of /etc/nginx/nginx.conf and add the following (admittedly I found this somewhere, modified it, and forgot where I got it):
    log_format json_logs escape=json '{'
        '"time":"$time_iso8601",' # IMPORTANT! We'll be parsing this time format.
        '"remote_addr": "$remote_addr",'
        '"request":"$request",'
        '"status": "$status",'
        '"request_time":"$request_time",'
        '"remote_user": "$remote_user",'
        '"remote_port": "$remote_port",'
        '"body_bytes_sent": "$body_bytes_sent",'
        '"bytes_sent": "$bytes_sent", '
        '"request_length": "$request_length", '
        '"connection_requests": "$connection_requests",'
        '"http_host": "$http_host", '
        '"http_referrer":"$http_referer",'
        '"upstream": "$upstream_addr", '
        '"upstream_connect_time": "$upstream_connect_time", '
        '"upstream_header_time": "$upstream_header_time", '
        '"upstream_response_time": "$upstream_response_time", '
        '"upstream_response_length": "$upstream_response_length", '
        '"upstream_cache_status": "$upstream_cache_status", '
        '"ssl_protocol": "$ssl_protocol", '
        '"ssl_cipher": "$ssl_cipher", '
        '"scheme": "$scheme", '
        '"http_user_agent":"$http_user_agent"'
    '}';
We can now add json_logs to the end of any access log line to tell it to log in json. For example:
    access_log  /var/log/nginx/blakehartshorn_com.access.log json_logs;
    error_log   /var/log/nginx/blakehartshorn_com.error.log;
Hit the http endpoint and you should see something like this in your access log:
cat /var/log/nginx/access.log
{"time":"2023-08-06T21:25:35+00:00","remote_addr": "127.0.0.1","request":"GET / HTTP/1.1","status": "200","request_time":"0.000","remote_user": "","remote_port": "45348","body_bytes_sent": "615","bytes_sent": "853", "request_length": "73", "connection_requests": "1","http_host": "localhost", "http_referrer":"","upstream": "", "upstream_connect_time": "", "upstream_header_time": "", "upstream_response_time": "", "upstream_response_length": "", "upstream_cache_status": "", "ssl_protocol": "", "ssl_cipher": "", "scheme": "http", "http_user_agent":"curl/7.88.1"}
Before we start shipping this to Loki, you have two options:
- Delete or move your existing *access.log files so the new ones are purely json.
- Handle parse errors accordingly in LogQL when querying from before this change.
Configure Promtail
I feel like just pasting my Ansible playbook here but that's opening a whole other out of scope can of worms. If you have more than 2 servers, plan on using config management for this at some point.
Following the previous instructions to install Promtail, go ahead and do this either on the new node, or the existing one you wanted to monitor (or your single homeserver if that's what we're doing here).
Install the acl package if you don't have it. Debian's log ownership for Nginx is www-data:adm and RedHat's is nginx:root. We'd prefer not to add Promtail to either of those security groups. This is where ACLs come in.
We're going to set the folder default to allow the promtail user to read new files created there, and then we're going to set the existing log files readable.
setfacl -d -m u:promtail:r /var/log/nginx
setfacl -m u:promtail:r /var/log/nginx/*.log
Okay, now /etc/promtail might not be writable by promtail, which is a problem if you let it spawn positions.yml there. So:
chown -R promtail /etc/promtailHere's an example /etc/promtail/config.yml for shipping Nginx logs. Fill in the HOSTNAME value accordingly.
server:
  http_listen_port: 9080
  grpc_listen_port: 0

positions:
  filename: /etc/promtail/positions.yml

clients:
  - url: http://HOSTNAME:3100/loki/api/v1/push
### Consider setting up basic auth if you put nginx in front of
### this for https/cert/security reasons.
#   basic_auth:
#     username: loki
#     password: "passwordhere"


scrape_configs:
- job_name: nginx
  pipeline_stages:
  - match:
      selector: '{job="nginx"}'
      stages:
      # This is why set set a standard timestamp in our
      # nginx config earlier. This will help Loki
      # interpret the timestamps for the logs as the
      # real ones instead of when they were shipped.
      - json:
          expressions:
            timestamp: time
      - timestamp:
          source: timestamp
          format: RFC3339
  static_configs:
  - targets:
      - localhost
    labels:
      job: nginx
      hostname: HOSTNAME
      __path__: /var/log/nginx/*access*.log
By the way:
Please use your sysadmin skills to put that Loki URL behind an Nginx proxy with some kind of certificates at some point. Beyond the scope of this article, already summarized a million other places. To save you some DuckDuckGo'ing, here's a how-to on the Linode blog.
Also, either setup basic authentication or setup allow rules for Grafana and Promtail IP addresses.
Adding to Grafana
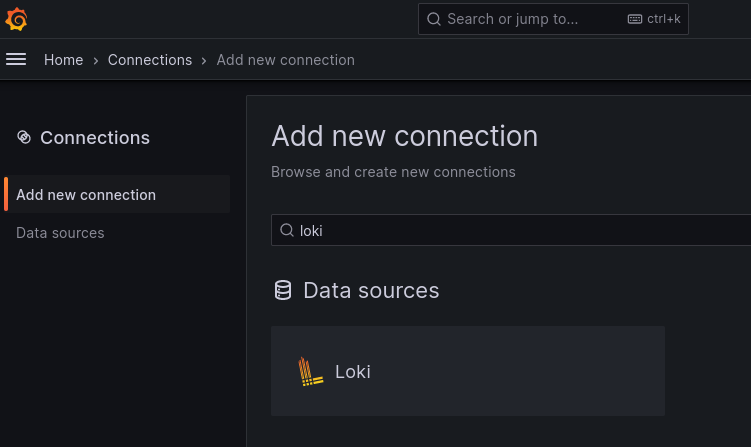
From the left hand menu, go to Connections and click the Loki pane.
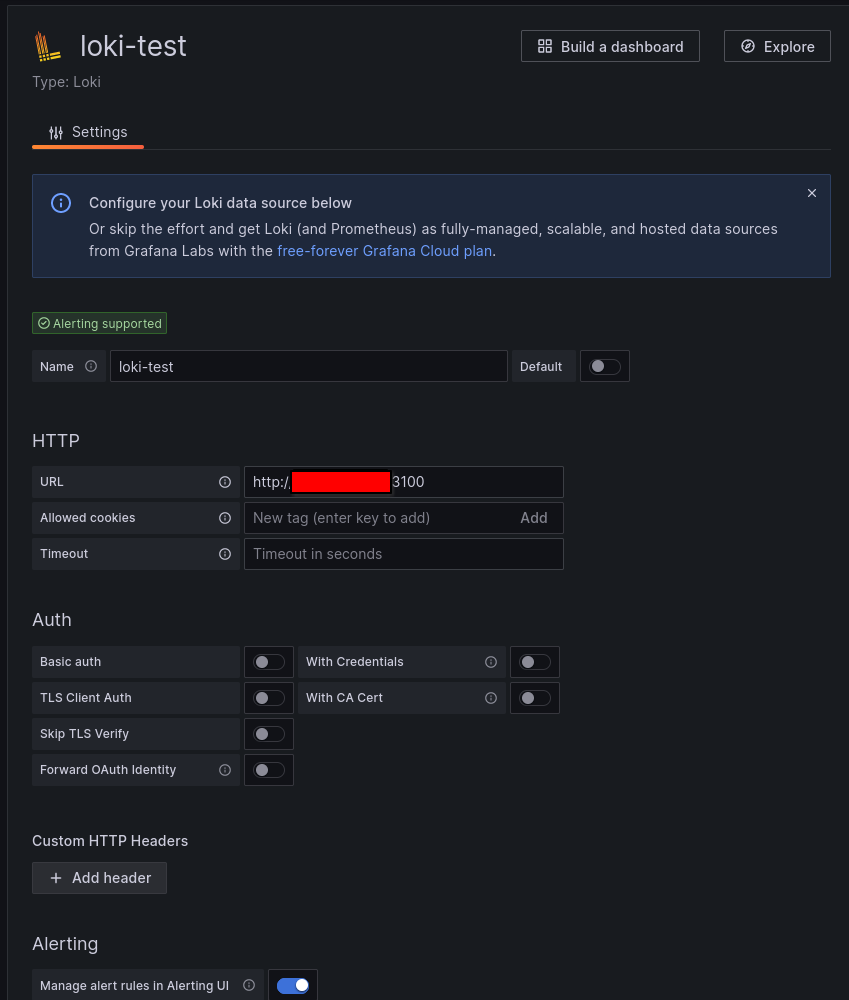
Add the URL to your Loki instance here. Grafana knows the usual path, you just need either IP:Port or your vhost if you setup a reverse proxy. Also, check basic auth if you set that up.
Let's look at some logs!
Go to the Explore pane in Grafana and select your Loki data source. A quick tap on the query builder and we can say which host we want, which nginx log we want, and to pass it to the json parser so all the keys map to labels.
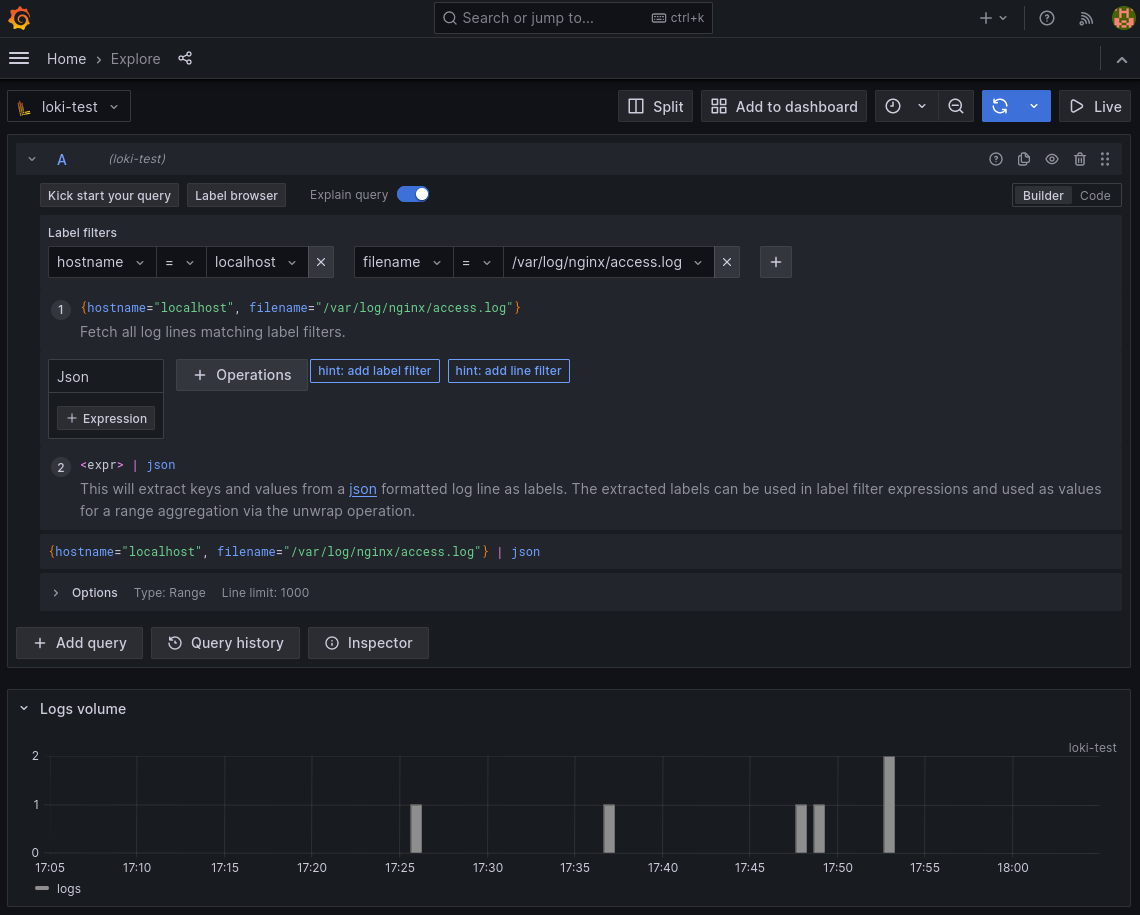
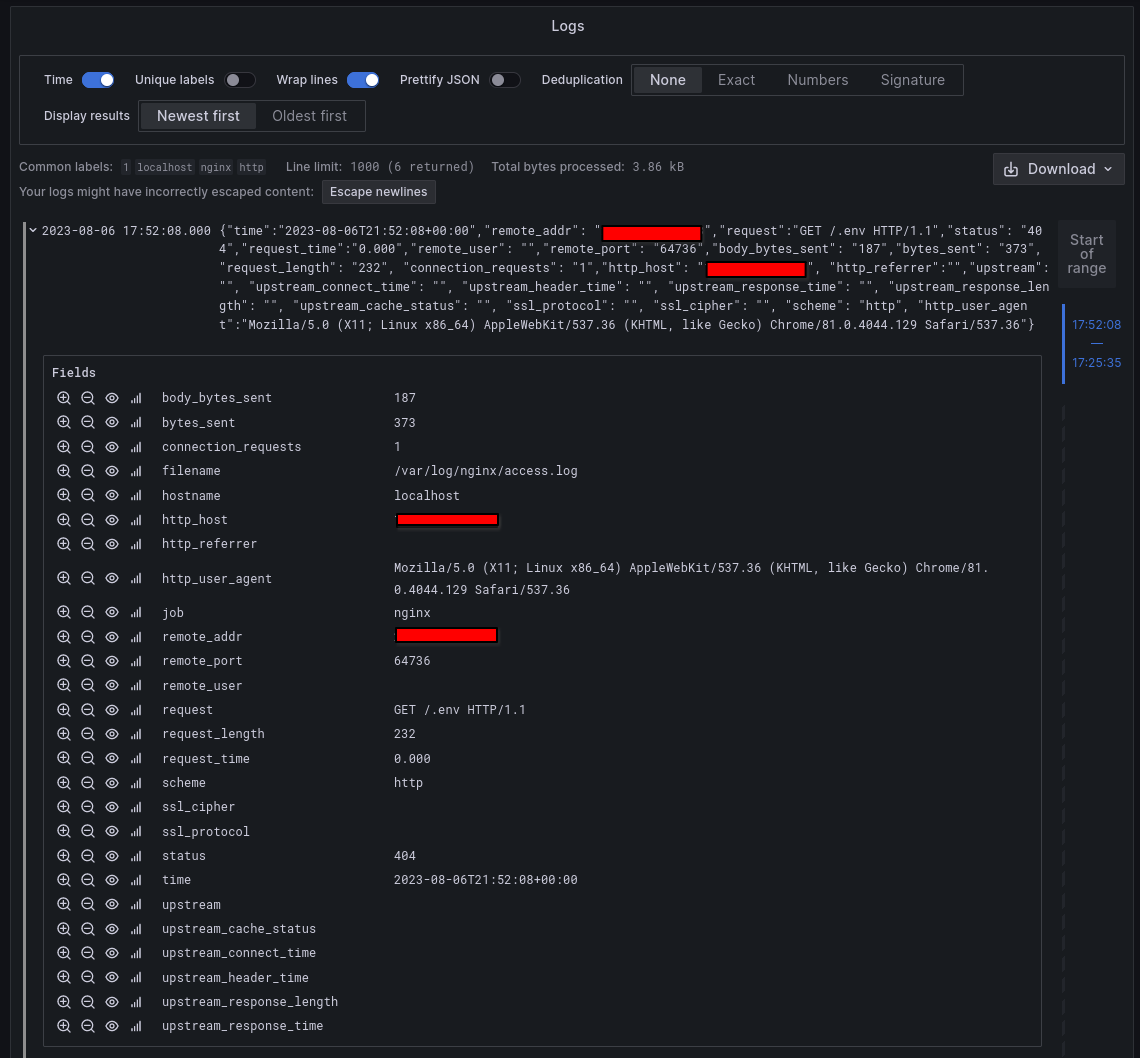
Check that out! I just stood this server up an hour ago and someone's already trying to exploit it! Awesome!
Feel free to play with the query builder as your log volume at this stage is so small you're not likely to break it. The official LogQL documentation from Grafana is fantastic and a short read, especially if you've used Prometheus before. Since we're able to use the json parser here, you'll find querying data to be much easier.
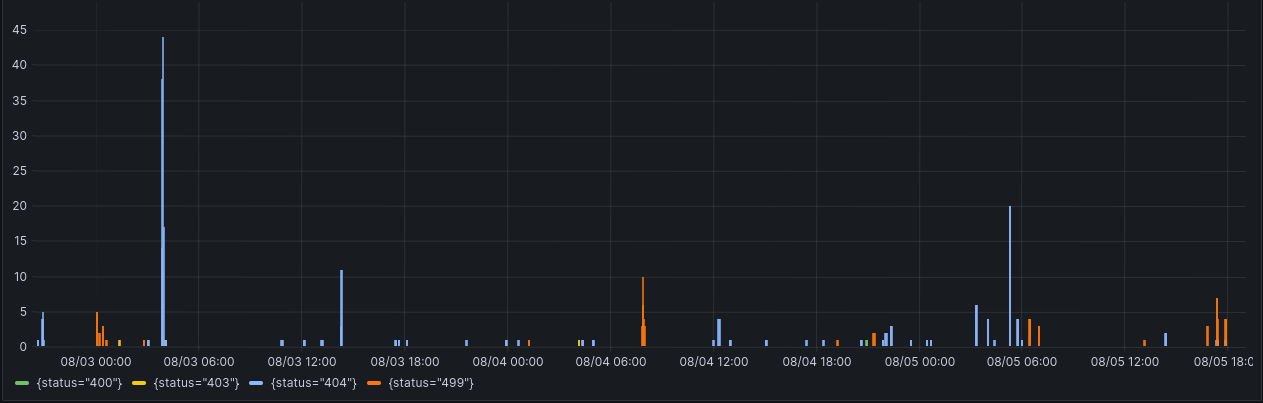
If you're looking at the heading graphic wondering how logs turned into metrics, you can actually query Loki for that kind of data like you would Prometheus. That panel is from my actual webserver dashboard, the query is:
sum by (status) (count_over_time({hostname="retiredwebserver.blakehartshorn.com", filename=~"/var/log/nginx/.*.access.log"} | json | __error__!="JSONParserErr" | status =~ "4.*" [5m]))Conclusion
I know I kind of threw you into the deep end here. If you didn't already have a test environment, hopefully the provided links got you going. If you start loving Loki, consider sprawling it out into a Kubernetes cluster at work and quickly query data going across your entire fleet. As it is, for a home server or a personal website, the single binary method should work nicely.